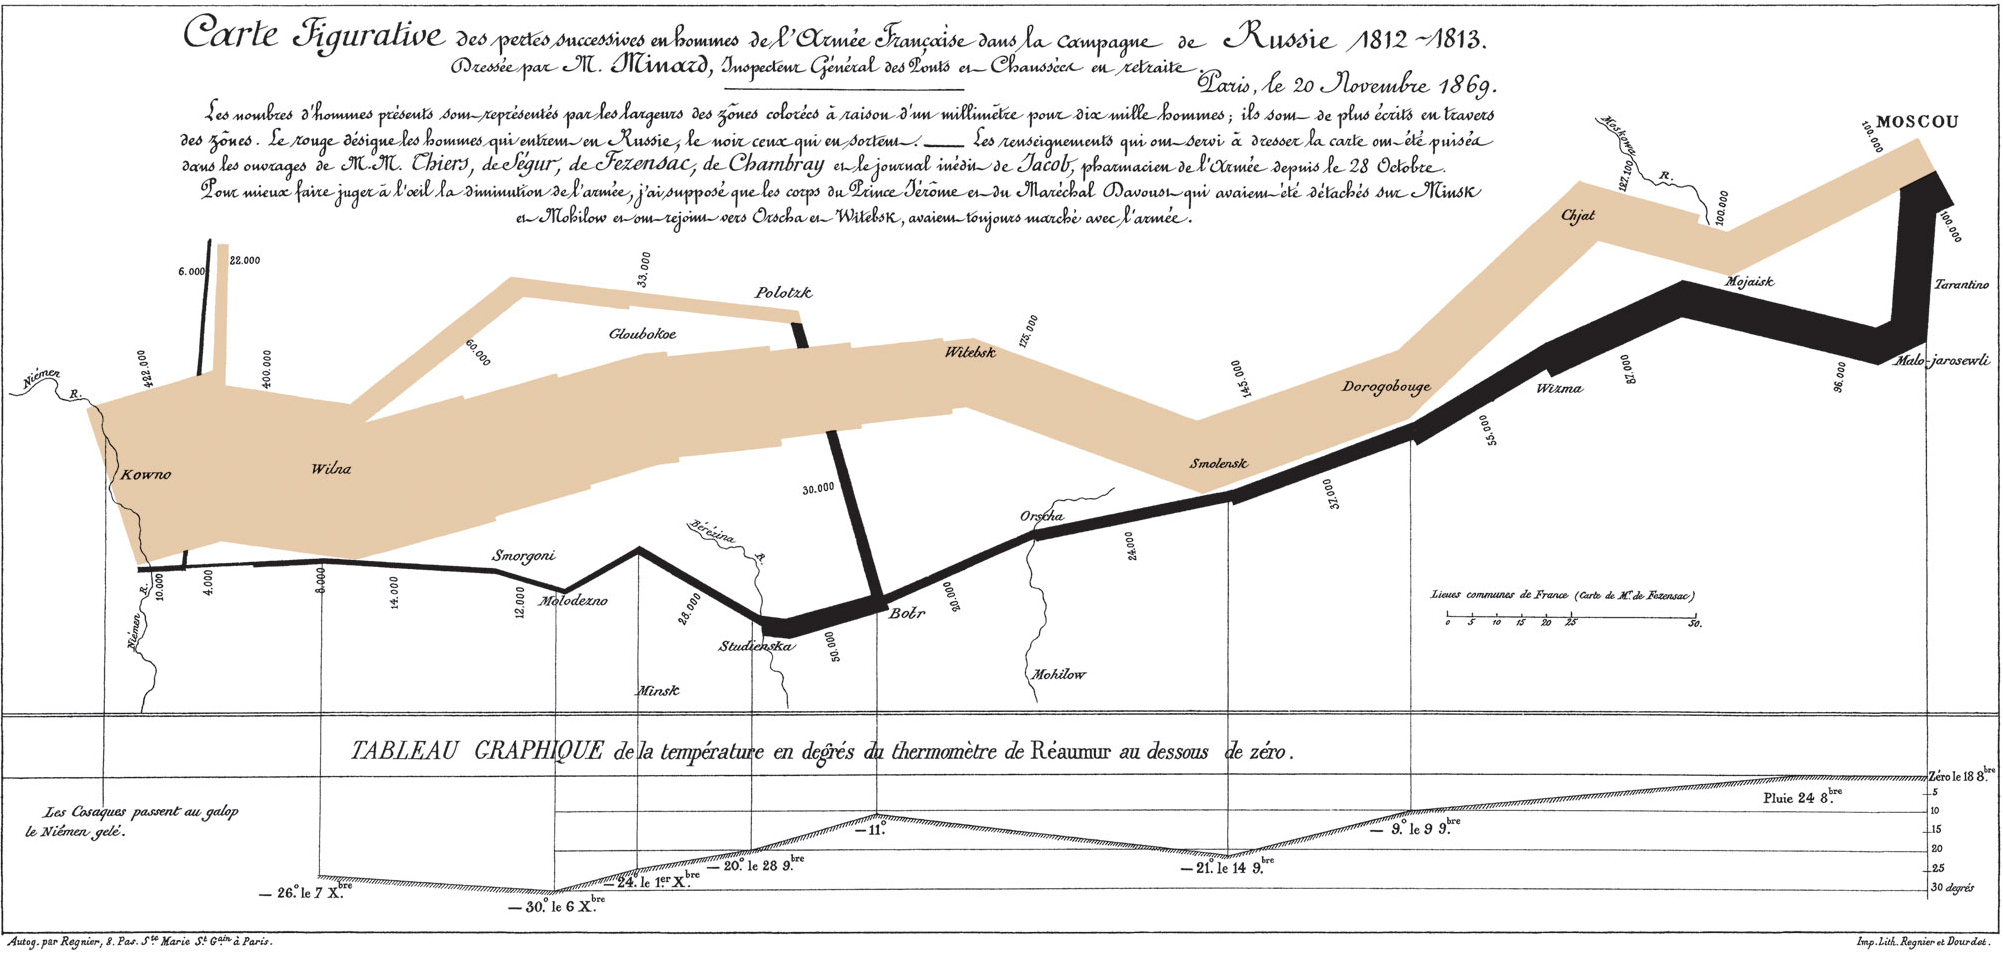
To me there are two aspects to data communication: aesthetics and functionality. Aesthetics is obvious, it’s the visual appeal of a graphic, but functionality is less obvious. Graphics have a functional purpose, which is to highlight patterns and trends in data in a visual way. A graphic is functionally successful when it is easy to understand the patterns in the data. This seems arbitrary, but in fact it can be quantified– you can measure the time it takes someone to process different graphical representations of the same data set. From this, you can derive principles that lead to graphics that have high functional value, or short interpretation times. For more info, read Tufte (on the Iridescent reading list!).
Given my background, I’m of course approaching the issue as a scientist, and as you might guess, science is almost entirely concerned with graphic functionality. Scientists are commonly working with extremely complex and inter-related data sets, and determining patterns from such data can be tricky. Using default graphics options can lead to visual clutter when dealing with complex data, and so many scientists take a lot of care in thinking how to present their data in ways that highlights the patterns they wish to emphasize. That being said, scientists place little care in aesthetics, often providing very ugly, but easy to understand graphics.
This is something I cared a lot about in grad school. I felt that someone’s ability to understand my data and take something away from my presentation was highly dependent on my ability to present that data clearly. I could have done an absolutely stellar research project, but with poor visuals few people would be able to understand or appreciate what I had done, so I put a lot of time into understanding data visualizations. (This desire to have people understand research is not common to all scientists– some just want to do really interesting research and could care less how many other people know about it). I took several courses in science communication, had a great advisor and fellow grad students who gave great data visualization feedback, read a lot of Tufte, made science posters with Ioana, and still spend a lot of time learning how to use data visualization tools like R and Illustrator. Anyways, I don’t always nail it, but I try to do the best I can in finding the best functional way to present data.
That being said, I have very little understanding of aesthetics. I still cringe when I look at outfits I picked out for myself as a kid in old pictures, I’ve always had a horrible color sense. What this means is that I might do a really good job figuring out what elements of a graph should all be the same color to aide pattern recognition, but choose a god-awful color to represent them.
But is there a conflict between an aesthetically pretty graphic and a functionally useful graphic? Not necessarily, and I can certainly think of graphics that do both effectively, like Napolean’s march.
But often designing for one purpose in isolation of the other leads to an aesthetic graphic that has poor function, or vice versa. Also, for simple graphics like percent of yes/no responses to a question, functionality really isn’t all that important. The least functional graphic is still not that hard to interpret for simple data.
But sometimes function and aesthetics are in conflict, and there are certain decisions about graphics use when one must choose between a more functional and a more aesthetic option. A classic example is Microsoft’s Excel’s defaults plotting settings, which regularly adds features that increase aesthetic value at the cost of functional value. (A good rule of thumb for making good functional graphics is to avoid default features on Excel graphs.)
So what does this mean for how I make actual graphs? I wanted to end by sharing a few of the principles I use when creating graphics, so you can understand the choices I make. I’ll occasionally bash on Excel’s graphic choices, because I can’t help myself 🙂 The basic Tufte-inspired idea behind all of these principles is to minimize whenever possible- if you are including something in a graph, it should be for good reason.
I’m including two examples from my graduate research that I think do a decent job of communicating patterns in data. First is a poster for a relatively mathy audience about a somewhat mathy topic.
Editor's note: The poster image from the original post is no longer available.
Notice none of my graphics are clean- I’ve marked up and put points right on the graphs and illustrations. I don’t have a block of text that refers to figure 1, I tried to seamlessly go between saying things with words to saying things with pictures. I didn’t want to create visual space between where my graphs were, and where the text was that referred to the graphs. Notice how the graphs use legends. Notice the relative size and boldness of component of the graph to draw focus and emphasis. Notice the graphs on the lower right- it was hard to understand what those jargon terms in the axes referred to, so I decided to include an actual picture on the graph showing the component of the organism being measured in each row of figures.
Next is a figure from my thesis.
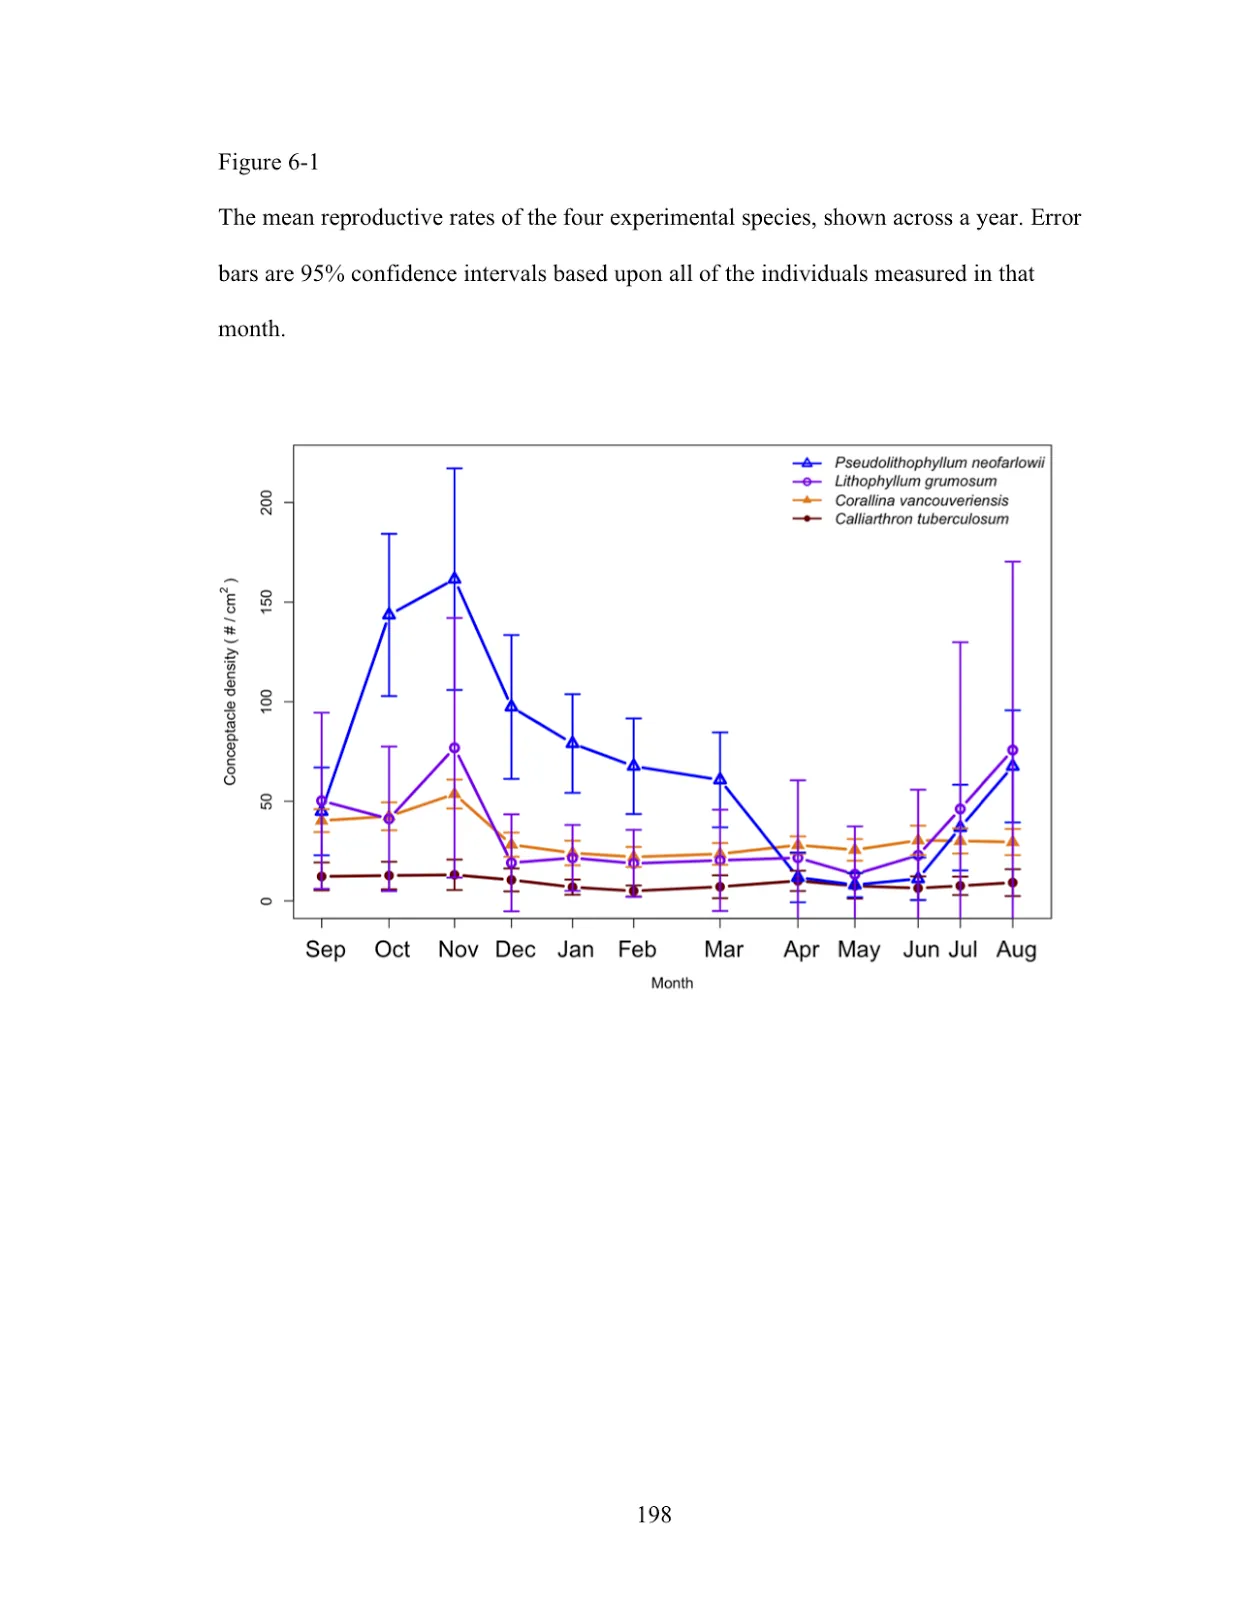
It shows how reproductive 4 different species of algal were throughout the year. Notice that the x-axis is not evenly spaced- they are spaced by when I actually measured the data, and because of tidal patterns I did not always measure them exactly one month apart. Notice the order of the legend corresponds to the general reproductive magnitude of the different species, which both makes it easy to link the data with species names and makes it easy to know which were most reproductive species on average—all the viewer has to do is look at the order of the legend. Notice the bottom two species are filled in icons, whereas the top two are open symbols- those species share a similarity in one dimension (being crustose or articulated). But notice that the first and third are triangles while the second and fourth are square, since those also shared similarities in a different dimension (r vs. K selected). But these are minor details for someone who was paying attention to this distinction in the text and really wants to dive in to how these dimensions effect these species. I didn’t make them prominent for a reason- they are present, but not the focus (these dimensions are actually the focus of the next graphic in my thesis). Notice error bars are the same color as the data they are related to for easy tracking, important when the bars overlap as much as they do here.
There’s a lot to think about–but all these little pieces add up to make a functional and (maybe if I’m lucky) aesthetically interesting data visualization.
Copyright 2026 Technovation. All Rights Reserved
in the United States